Occasionally a visitor to my website emails that they are not happy about the chart placings that I list for Australian records. They are usually people who are heard on those very records. That is to say, artists.
There are two sources of disappointment: The Legendary International Hit and My Record Did Better Than That! The quotes below are not real examples. I'm improvising around the theme of emails
I've had over the years from artists about the insultingly low chart
placings I've listed for their records from the 50s, 60s, or 70s.
1. The Legendary International Hit
• Our manager definitely told us we were #10 in Los Angeles.
• We were shafted by the Aussie music business, but our record charted Top 20 in Pennsylvania!
• Oh yeah, we were big all over the world. #1 in Sweden, Greece and Czechoslovakia.
These claims are nearly always wrong, and I usually know that before I've checked the sources.
You can also see statements like these in old newspaper stories. Back then, who was going to check any of this? There were no obsessive smart alecs like me who would go online and dig around till they found an answer. There was no "online", for a start.
If you said in 1965 that a record was big in Hungary, how would an Aussie music journo or the work experience kid from Go-Set know anything different? In any case, the effort and resources needed to do a fact-check would be ridiculous for a harmless little claim like that.
I wouldn't suggest that the artist made it up, because they seem sincerely to believe the legend. It's more likely to have originated with a creative publicist or journalist. Or a manager.
My favourite hypothesis is that somebody mailed a chart (in an envelope, with a stamp) from an obscure locality in the US where our artist was racing up the chart at the local radio station, and everyone jumped to the wrong conclusion. (How about a chart from WNRI Woonsocket, Rhode Island, say?) But more later on radio station charts.
Honourable mention In 1976, Sydney singer Jeff Hilder told The Sun-Herald that he was back in Australia after living in Venezuela where he had been on the local charts.
Yeah right, thought this smart alec. We'll see if that stands up to 21st century fact-checking.
Well, it's not easy to find archival Venezuelan charts, but I found Jeff at #6 in Venezuela in February 1972 with a song called Mañana será otro día.
Sorry I doubted you, mate.
2. My Record Did Better Than That!
• But we were #5 in Melbourne! Here's the actual 3DB chart that I clipped from the newspaper.
• How could I have been only #16 in Adelaide when I was #5 in Australia overall?
This is more complicated, partly because people have such faith in The Charts of the past. It's as if they were handed down in stone by some all-seeing data collector in the sky, who knows exactly how many 45s were sold in any week in 1965. So if they see #5 printed somewhere, it must be #5. Read on to see why not.
Retrospective charts The charts that we consult today for Australia in the 50s, 60s and 70s have been retrospectively compiled from whatever data is available from those years. This pretty much means radio station charts, also known as surveys. (It makes sense, given that the rise of the Top 40 chart, and the loose genre of Top 40 music, came from American radio in the 1950s.)
Each station with a music format would publish its own chart, distributed as a leaflet by music stores, or printed in the local paper.
In larger cities there could be several charts, and they would all be different.
It wasn't until the 1980s that Australian record charts started to reflect reliable sales figures, when the national ARIA chart was established, initially using data from Kent Music Report. In 1997 ARIA started collecting data electronically, direct from music
stores, giving rise to the modern concept of a music chart being based
on hard sales data. Set in stone, you could say.
The pool of radio station charts would change over the years, as stations changed their formats or stopped publishing charts. For example, Gavin Ryan's Melbourne chart book uses 1967 charts from the 3DB Top 40, the 3AK Top 100, and 3UZ's Official Top 40 (officially 3UZ's, maybe, nothing more).
Radio charts Back then the radio charts were compiled from a number of sources. If a chart did list its sources, it might include record sales, listener requests, or audience surveys.
Charts from 2UE Sydney and 4BK Brisbane in the 1960s cited "public survey" as well as sales. Public survey could mean anything, and would allow leeway in constructing a chart to reflect the station's playlist and its listeners' preferences.
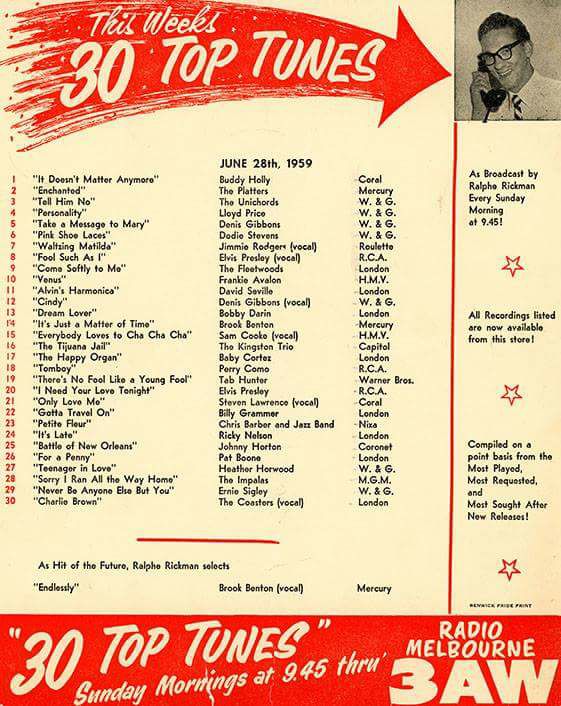
For Melbourne station 3AW in 1959 the
chart was
compiled on a point basis from the most played, most requested, and most sought after new releases. ("Most sought after" sounds especially rubbery. See also my blogpost
3AW creates a chart.)
It's not uncommon to find a song that charted at one station but not at another in the same city.
As chart collector and compiler Tom Guest puts it, At times 'hits' were played on one radio station only and thus appeared on their own charts and not on those produced by stations who, for various reasons, did not include the songs on their airplay lists.
Sales figures and radio charts Sales figures were based on samples rather than comprehensive data from every outlet in town. Wayne Mac, in his radio history Don't Touch That Dial, writes:
To compile the 40 most popular songs, stations telephoned selected record stores in their area which reported sales figures on records and sheet music. In addition to raw sales figures, the position or ranking of the week's 40 most popular songs was also subject to overseas sales trends and a station's own predictions ...
I don't believe the collection of sales data was always a rigorous process. The ring-arounds to local record stores could be as informal as asking what was selling. One of my reliable correspondents, who worked at a capital city record store, says that it depended on whoever happened to answer the phone, as it wasn't unusual for that person to boost their favourite records.
Retrospective charts can disagree The job of the latter-day chart compiler is to apply some kind of statistical method to reconcile the differences and come up with plausible charts for a city.
At my website I use Gavin Ryan's charts for Sydney, Melbourne, Brisbane, Adelaide and Perth. For two cities there are alternatives: Tom Guest's Melbourne chart book (Thirty Years of Hits) and Top 40 Research's chart book for Sydney (The Book).
This could be confusing to a casual reader. If Gavin Ryan's Sydney chart book has The Rolling Stones' The Last Time peaking at #1 in April 1965, that's it, isn't it? Either The Last Time was #1 in Sydney or it wasn't. So how is it that the other Sydney chart book, The Book, has it peaking at #2?
Sometimes the contrast is greater: down in Melbourne, Gavin Ryan has The Ray Price Quartet's A Moi De Payer (1962) at #6, Tom Guest has it at #24.
Clearly, these differences are partly down to differences in statistical methods. I'm not privy to these, but Tom Guest told me that he weighted his placings in favour of 3UZ, the highest rating Top 40 station in Melbourne during the 60s, something that makes good sense to me. Even so, Tom has The Groove's Simon Says peaking at #6, and it's Gavin who has it spot on the 3UZ peak at #4. (Add 3DB's #8 to the list and you have three different peaks for the song.)
Another variable is the availability of historic charts to each compiler. Some of them can be found in newspaper and magazine archives, but otherwise it depends on chart collectors. The compilers I know of started out as collectors, but there can be gaps in the charts they can access. Gavin Ryan lists his sources in each book, with a note to the reader: If anyone has further charts that are not listed above, I would be most appreciative if you could pass them on to me for future updates of this book.
Comparing radio charts In spite of these variables, and the presence of outliers in many charts, popular songs could follow similar trajectories in and out of competing station charts.
As one example, I looked at the chart history of an Australian record from 1967, Simon Says by The Groove, as it charted at 3UZ and 3DB in Melbourne. (Chart site ARSA has an uninterrupted run of charts from these two.) It shows up how the charts could differ from each other in detail, but it also shows how close they could be.
Simon Says was on the charts from September 1967 to January 1968. It did better on 3UZ than on 3DB.
3UZ: 18 weeks on the Top 40, 4 weeks in the Top 10, peaked at #4.
3DB: 16 weeks on the Top 40, 2 weeks in the Top 10, peaked at #8.
National charts Even the standard national Australian charts for these early decades, now published by David Kent, are based on radio surveys. As he puts it at his website, before rock'n'roll and in the earliest Top 40s, Hit Parade lists were compiled from sales of sheet music as well as records, plus other factors such as public requests and (perhaps) the opinions of radio stations’ personnel!
David Kent's own Kent Music Report provided the de facto official national charts from 1974 till 1983 when ARIA started its charts. Even then, Kent's data, which had increasingly emphasised sales figures over radio surveys, was licensed to ARIA until 1988.
Go-Set's national charts An earlier national Top 40 had been published in Go-Set magazine 1966-1974 (now published online at gosetcharts.com). It was compiled by Ed Nimmervol using, according to chart historian Daniel Lowe, a combination of sales figures from retail stores as well as... data from the radio stations charts from around the country.
Even so, in 1968 (for example) the Go-Set carts were simply headed with This chart is calculated each week from the most recent charts from the following radio stations: 2UW, 2UE, 3UZ, 3AK, 3DB, 3XY, 4BC, 4IP, 5AD, 6KA, 6PR, 6KY, 7LA, 7HO.
(The earliest charts in Britain were also compiled by music magazines. The New Zealand Listener magazine's charts 1966-75, initially based on reader polls, are often cited as the de facto NZ charts for that time.)
What should we make of all this? So if the retrospective charts we have now are not strictly a reflection of how well records actually sold back in the day, but seem to be based on sources that were open to all sorts of biases, are they a pointless exercise? If #10 in 1967 doesn't necessarily mean #10 as we understand it from say, the modern ARIA charts, am I wasting my readers' time by including chart positions at all?
Well, no. And no. It's possible to be too cynical about these collections of playlists, selective sales figures, and whatever the radio stations wanted to type into their charts.
Even if they were nothing more than a collection of radio playlists, they would provide a pretty good snapshot of what we were listening to at the time.
At the website of pirate station Radio London (The Big L), the compilers of the Fab 40 charts understand this. Not only are they explicit about the fact that the Big L charts were never compiled from figures supplied by retailers, but they consider this to be an advantage: These Radio London Fab Forty charts differ very much from the National or 'Official' sales-based charts of the time, in that they contain numerous entries from obscure recording artists. Those quotes around 'Official' almost look like a put-down.
In the 50s and 60s, we listened to radio. There was no Spotify or YouTube, no instant downloads or file sharing. There was radio, some TV, and some vinyl if you could afford it (I usually couldn't: most of my 45s were oddities from the cut-out bins). But mainly it was radio. Our generation had a transistor radio to an ear at every possible moment. We woke up to Top 40 radio and we fell asleep to it.
Listening in to Melbourne, I was a dial surfer, from The Greater 3UZ, over to 3DB for Barry Ferber, and on to 3AK or 3KZ as the whim took me. I became a fan of 3XY when it flipped to a pop format.
As a result, if I browse through the Melbourne chart books of Gavin Ryan or Tom Guest, compiled using charts from several stations, I am looking at a recognisable analogue of my teenage listening experience and, I assume, that of my readers.
Remember too, that radio stations were in a competitive commercial
industry. It
was their job to tap into the tastes and preferences of their audiences, and I doubt that their playlists and charts were compiled offhandedly. A retrospective chart based around radio playlists still has credibility, even if its sources were not based strictly on sales data.
A final digression My habit of switching stations must have been common, because when 3XY changed its format from adult-oriented albums to Top 40 singles, it placed its news at 10 to and 10 past the hour, an innovation from America. The thinking was that kids listening to the established stations would twiddle the dial in search of music when the news came on at the top of the hour. At that time 3XY would be playing a record, so the kids might discover the station and stay... But maybe only till 10 past when the news came on!
Related My post about historical New Zealand charts Introducing the N.Z. Hit Parade! (March 1966).
Toppermost of the poppermost are John Lennon's words, but you probably know that by now.
Sources I haven't used academic footnoting, but I've drawn on these sources.
• Daniel Lowe's informed, concise overview of the history of Australian charts. [Offline but archived here.]
• Detailed chart history at Milesago which covers Australia and other countries: Top 40 Radio and the Pop Charts
• The indispensable
ARSA - The Airheads Radio Survey Archive
• Wayne Mac, Don't Touch That Dial: Hits & Memories of Australian Radio (2005)
• Gavin Ryan's Music Chart Books for Sydney, Melbourne, Brisbane, Adelaide and Perth 1953-2013, (2004-2007)
• Thomas J. Guest, Thirty Years of Hits: Melbourne Top 40 Research 1960-1990 (1991)
• Jim Barnes, Fred Dyer and Stephen Scanes, The Book, Top 40 Research Services (1986)
• Website for David Kent's Australian Chart Books (includes online store)
• Alan Smith's history of British charts at Dave McAleer's website [Internet Archive]
• New Zealand's Lever Hit Parades 1960-66 and NZ Listener Charts 1966-74 with brief commentary at Flavour of New Zealand.
Collectors' Corner Here is my entire collection of authentic 1960s charts
: